

Marketsmith, Inc is an agency with a focus on media, direct response. They are a privately held agency.
Explore a detailed list of current and past client that work with Marketsmith, Inc. Sort clients by location, industry, and agency assignment including creative, PR, media planning, media buying and more. With Winmo’s detailed database, you can quickly see which clients list Marketsmith, Inc as the Agency of Record as well as the annual media spend.
Does Marketsmith, Inc have a holding company?
Independent/Other is the holding company for Marketsmith, Inc.


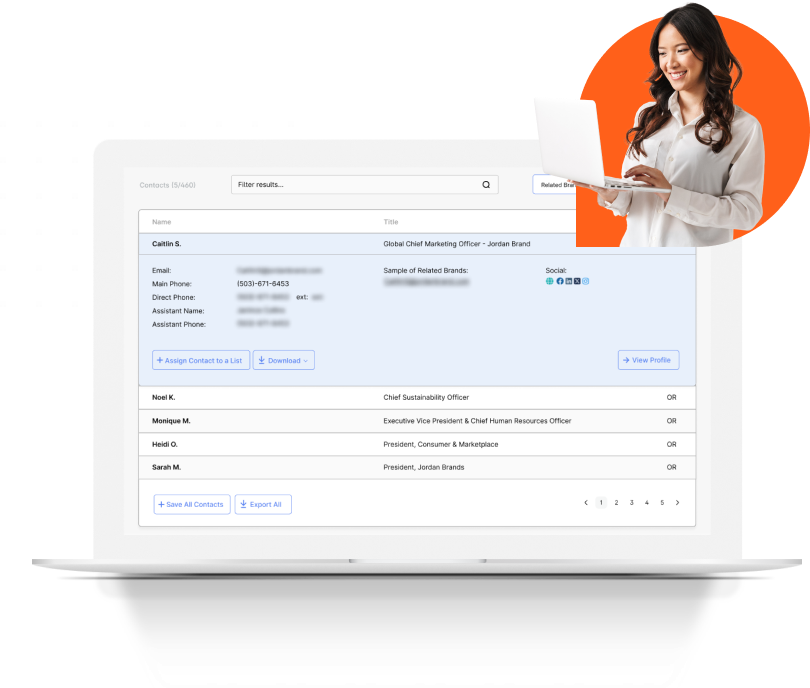
Explore a complete list of Marketsmith, Inc employees. We not only have the basics on each team member such as name, job title, brand responsibilities, email, and direct phone number, we also have detailed profiles that include unique insights, do’s and don’ts for engaging, plus both DiSC and Ocean personality profiles.
How many employees does Marketsmith, Inc have?
Marketsmith, Inc has an unknown number of people on their staff.


If you are looking to tap into marketing spend managed by Marketsmith, Inc, Winmo paves a clear path to engaging the right contacts at the right time. Whether you are navigating large holding company agencies, or need to know account responsibilities of boutique shops, Winmo connects agencies, clients, and ad spend in an intuitive platform built for new business - even providing you with AI-powered email templates based on Marketsmith, Inc decision-makers' personality types. Winmo's award winning platform tracks this intel for those who control $100 billion in marketing spend each year, making it the top choice among sellers of agency services, advertising, marketing technology, or corporate sponsorships.
Request trial to view full profile and more!
Looking for a resource to grow your sales? Winmo helps you source more leads by connecting with the right prospects at the right time.